Overview
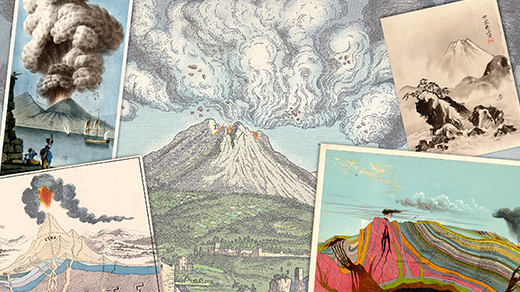
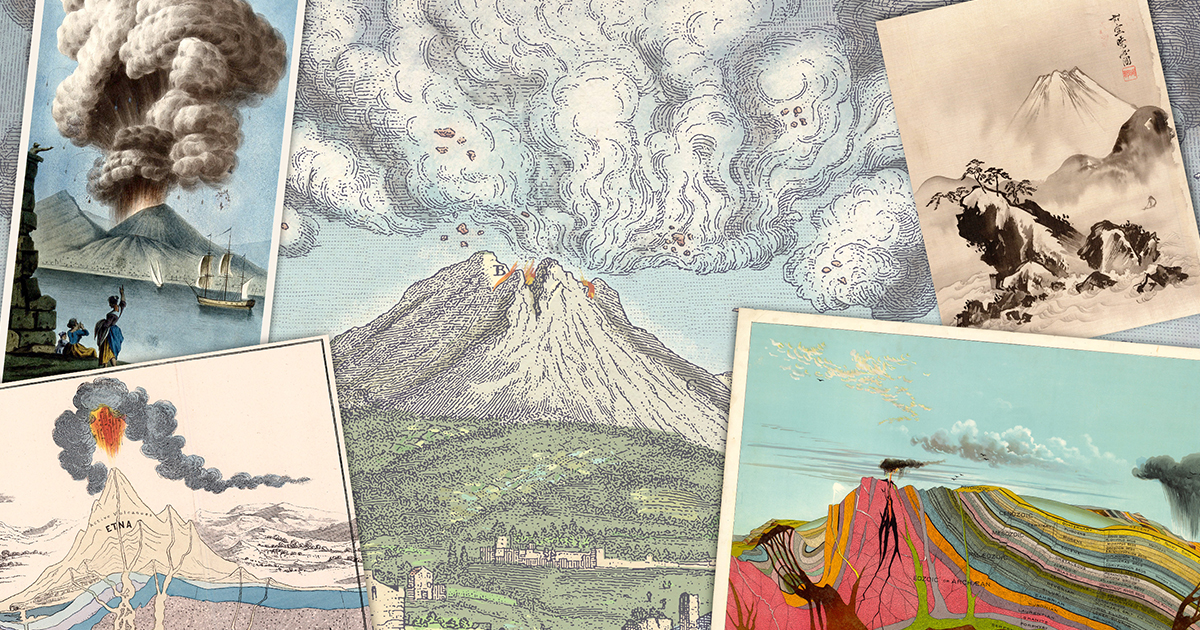
In the summer of 1991, Mount Pinatubo in the Philippines demonstrated the raw power of volcanic eruptions and the limitations of our predictive capabilities. The eruption began on June 12 and culminated three days later in a cataclysmic explosion that obliterated the summit, leaving behind a 2.5-kilometer-wide caldera. Pyroclastic flows—incandescent avalanches of molten rock and gas—raced down the slopes, killing hundreds and displacing thousands. While scientists successfully issued warnings that saved many lives, the event underscored the immense challenge of forecasting eruptions with the same precision as weather. This guide provides a detailed, step-by-step look at how volcanologists work toward that goal, blending monitoring technologies, geological understanding, and probabilistic models.
Unlike weather, which we can predict days in advance for large-scale patterns, volcanic eruptions involve complex subterranean processes that are often invisible until it's too late. However, advances in seismology, gas chemistry, geodesy, and satellite imagery have dramatically improved our ability to anticipate eruptions—sometimes weeks ahead. This tutorial will walk you through the core methods, real-world examples (including Pinatubo), common pitfalls, and the future of volcanic forecasting.
Prerequisites
To fully engage with this guide, you should have:
- A basic understanding of volcano types (stratovolcano, shield volcano, etc.) and eruption mechanisms (magma ascent, degassing, decompression).
- Familiarity with geophysical concepts like seismic waves, deformation, and gas emissions.
- An appreciation for probability and uncertainty—forecasts are never 100% certain.
- Access to or interest in public volcano monitoring data (e.g., USGS, GVP, VAAC).
No advanced math or programming is required, but we will touch on data integration techniques.
Step-by-Step Instructions for Volcanic Eruption Forecasting
Step 1: Understand the Volcanic System
Before any monitoring, you must characterize the volcano's plumbing system. This includes the magma chamber depth, composition (basaltic vs. rhyolitic), and the volcano's past eruption history. For example, Pinatubo had a long dormancy (500 years) before 1991, which made its reawakening surprising. Key questions: What is the magma supply rate? Are there hydrothermal systems? What is the structure of the conduit? Use geological mapping, seismic tomography, and petrology to build a baseline model.
Step 2: Monitor Seismic Activity
Seismicity is the most immediate sign of magma movement. Install a network of seismometers around the volcano. Look for:
- Volcano-tectonic earthquakes: Caused by rock fracturing as magma pushes upward. Frequency and location indicate depth and direction of dike propagation.
- Long-period events: Caused by resonance in fluid-filled cracks, often preceding eruptions.
- Harmonic tremor: Continuous signal from magma and gas movement, a strong indicator of imminent eruption.
For Pinatubo, a surge in seismic activity in April 1991 triggered the first evacuations. Modern networks can detect changes in real time, but interpretation requires separating tectonic from volcanic signals.
Step 3: Track Ground Deformation
As magma accumulates, it inflates the volcano's surface. Use GPS stations, tiltmeters, and satellite radar (InSAR) to measure deformation rates and patterns. Typical signs include:
- Radial swelling of the edifice (inflation).
- Cracks or fissures on the flanks.
- Subsidence when magma withdraws.
At Pinatubo, precise leveling surveys detected 1.5 meters of uplift near the crater in the months before the eruption. InSAR now allows global monitoring without ground access.
Step 4: Measure Gas Emissions
Rising magma releases gases—especially SO2, CO2, and H2S. Increase in SO2 flux often precedes eruptions. Methods:
- COSPEC (correlation spectrometer) for airborne measurements.
- Multi-GAS stations for ground-based CO2/SO2 ratios.
- Satellite sensors (like TROPOMI) for global coverage.
Before Pinatubo, SO2 emissions rose from background to thousands of tons per day. However, gas can be trapped or scrubbed by groundwater, complicating interpretation.
Step 5: Analyze Thermal Anomalies
Satellite thermal infrared data (e.g., MODIS, VIIRS) can detect heat from new lava, hot domes, or crater lakes. Look for temperature anomalies that correlate with other indicators. For example, a new fumarole field may appear days before an eruption. This method is especially useful for remote volcanoes.
Step 6: Integrate Data and Build Probability Models
No single indicator is reliable. Volcanologists use multi-parameter decision- support systems (e.g., the USGS's now-migrated AVID system) that combine seismicity, deformation, gas, and thermal data into a probabilistic forecast. For example, if both seismic swarm and SO2 spike occur, the probability of eruption within 7 days might rise from 20% to 80%. Bayesian networks are common for such integrations. The goal is to produce a forecast bulletin with alert levels (green, yellow, orange, red).
Step 7: Communicate and Act
Translate the probabilities into actionable warnings for civil authorities. Lessons from Pinatubo: timely communication saved tens of thousands of lives. Follow established protocols (e.g., the Hawaiian Volcano Observatory's response plan). Provide clear maps of hazard zones, establish exclusion areas, and coordinate with local government and media. Always account for uncertainty—avoid false alarms that erode trust, but also avoid under-warning.
Common Mistakes
Forecasting eruptions is fraught with pitfalls. Here are frequent errors:
- Overreliance on a single indicator: Seismic activity can be triggered by tectonic earthquakes, not magma. Gas may be masked by rain. Always cross-validate.
- Misinterpreting harmonic tremor: Not all tremor leads to eruption; some reflects steady magma degassing. Context matters.
- Ignoring historical patterns: Volcanoes have personality—some inflate without erupting, others erupt without inflation. Pinatubo's 500-year silence lulled earlier warnings.
- False alarms versus missed forecasts: The balance is delicate. In 1985, Nevado del Ruiz was not evacuated despite warnings, leading to a disaster. Conversely, over-warning can cause economic damage and desensitize the public.
- Neglecting hydrothermal systems: Groundwater changes can mimic eruption precursors (e.g., phreatic explosions).
Summary
Forecasting volcanic eruptions like weather is an aspirational goal, but we are making steady progress. By integrating seismic, geodetic, gas, and thermal monitoring with probabilistic models, scientists can now provide valuable early warnings—often days to weeks in advance. The Pinatubo eruption of 1991 remains a landmark case: while the exact timing and magnitude were not predicted, the data led to evacuations that saved countless lives. Key takeaways: no single method suffices; understanding the volcano's plumbing is essential; communication must be clear and cautious. As technology improves (drones, AI, denser seismic arrays), our forecasts will become more reliable, though absolute prediction may always be elusive. The ultimate lesson: respect the mountain's complexity, but never stop trying to listen.